Website Traffic Rankings: How Accurate Are Those Lists?
Website traffic rankings are estimates, not counts. The visit number a third-party tool shows for a competitor is a statistical model built from sampled browsing data, partner feeds and public...
Website traffic rankings are estimates, not counts. The visit number a third-party tool shows for a competitor is a statistical model built from sampled browsing data, partner feeds and public signals, so it is useful for comparing similar sites over time but unsafe as an exact KPI. Independent tests show errors ranging from modest to severe, and the error is largest for small sites, so treat every ranking as a range with a stated margin of uncertainty.
This guide explains what website traffic rankings actually measure, what independent tests found about their accuracy, why two tools disagree, a decision table for when to trust an estimate, a validation routine you can run in an afternoon, and a reporting template that avoids false precision.
Contents
- What website traffic rankings actually measure
- How accurate are they? What independent tests found
- Where the estimate goes wrong
- Why different tools show different traffic
- What rankings are good for
- What rankings are not good for
- Rank positions versus visit estimates
- Decision table: can I rely on this number?
- How to validate an estimate in an afternoon
- How much should you spend validating the data?
- A reporting template that avoids false precision
- Common mistakes
- Frequently asked questions
What website traffic rankings actually measure
First-party analytics measure activity recorded by the website itself. Depending on the setup, that includes sessions, users, page views, events, conversions and revenue. Tools such as Google Analytics collect this through tags or SDKs installed on the site, and Google Search Console reports how the site performs in Google Search from Google’s own data.
A third-party traffic platform cannot see that dataset for a competitor. Instead it observes a sample of online behaviour and estimates the part it cannot see. Typical inputs are:
- Clickstream and panel data: browsing behaviour from opted-in users, apps, browser extensions or other data partners.
- Search visibility models: keyword rankings multiplied by estimated click-through rates to infer organic search visits.
- Partner and public data: direct measurements from sites that connect their analytics, public signals, advertising data.
- Statistical modelling: weighting and extrapolation from the observed sample to the wider population.
The output is a modelled estimate. A figure of 4.2 million monthly visits should be read as “the provider’s model places this site at roughly this level relative to others in the chosen market, device set and period”, not as an audited count. That does not make the data useless; it makes it a different kind of evidence from a server log.
How accurate are they? What independent tests found
Several independent studies have compared estimates with real analytics. They disagree on details, which is itself informative.
| Study | Design | Main findings |
|---|---|---|
| SparkToro (Rand Fishkin), 2022 | Compared four tools with Google Analytics data voluntarily shared by 641 sites, about 7,692 site-months (June 2020 to June 2021) | As reported, Semrush had the highest correlation with Google Analytics (about 0.79), then Datos (0.72), Similarweb (0.66) and Ahrefs (0.50). Similarweb landed within plus or minus 30% of actual numbers roughly two thirds of the time for larger sites, but was the least accurate for sites under about 5,000 monthly visitors. Ahrefs estimates organic search only, so the comparison was not like for like. |
| Screaming Frog, 2016 | 25 sites, three tools, UK organic traffic against Google Analytics over three months | Similarweb overestimated total visits by about 17%, Ahrefs underestimated by about 17% and Semrush by about 30%. Sites under roughly 10,000 monthly visits had errors above 40%. Single sites varied widely between tools. |
Two cautions apply to this evidence. First, the studies are old relative to the tools: vendors have changed their data sources and models since 2016 and 2021, so exact percentages should not be assumed to hold today. Second, each study measured something slightly different (total visits, organic search only, users versus sessions), so numbers cannot be stacked into a single “accuracy score”. What does repeat across studies is the pattern: broad agreement on large sites, large errors on small sites, and tools that disagree with each other by wide margins.
The practical reading: if a tool says a site gets 20 million visits, the true figure might plausibly be well above or below that, but the site is clearly large. If a tool says a niche B2B site gets 3,000 visits, the figure could be several times too high or too low.
Where the estimate goes wrong
Several sources of error recur. Size and direction vary by provider, country, device mix and website type.
| Source of error | What goes wrong | Still useful for |
|---|---|---|
| Panel and clickstream bias | The sample may over-represent certain countries, devices, browsers or demographics | Relative comparison between sites with similar audiences |
| Search-visibility models | Estimated search traffic can miss brand demand, long-tail queries, local results, SERP features and non-search channels | Judging organic-search potential for content-led sites |
| Sparse data on small sites | Few observations force heavy extrapolation, so the margin of error is wide even when the number shows many digits | Little; use with extreme caution below a few thousand visits |
| Device and identity resolution | One person on several devices, shared devices or privacy tools distort users and sessions | Broad direction of travel |
| Domain and subdomain allocation | Traffic may be split across subdomains, apps, redirects, international domains and parent-company properties | Comparing clearly defined domain groups after checking scope |
| Short-term extrapolation | Campaign spikes, outages, launches and holidays can be over- or under-weighted | Longer trends over consistent monthly or quarterly windows |
| Lag | Models can trail a sudden ranking change, viral story or migration | Spotting slower shifts over three to six months |
| Non-web traffic | Apps, email, offline advertising and direct navigation may be poorly covered | Almost nothing for app-first businesses |
Smaller and fast-growing sites are the most exposed. A niche domain has few observations, and a growing one outruns the model.
Why different tools show different traffic
Disagreement between platforms does not mean one vendor is dishonest. The tools may be measuring different things.
- Different definitions: visits, sessions, users or page views are not interchangeable.
- Different geography: a global estimate is not comparable with one for the United Kingdom, the United States or a single city.
- Different time windows: a rolling 28-day estimate differs from a calendar month.
- Different device coverage: desktop web, mobile web and apps may be reported separately.
- Different domain scope: one report may include a blog, store and help centre while another excludes them.
- Different channel models: paid, organic, direct, referral, social and email are allocated by different rules.
An organic-only estimate can help for a publisher whose visits come mainly from search, but it will badly understate a brand that gets most traffic from an app, email database, offline advertising or direct navigation. Using “estimated organic traffic” as if it were total traffic is a classic error.
Before comparing two numbers, document five fields: domain scope, country, device type, date range and metric definition. If any of them differ, the comparison is not clean enough for a serious conclusion.
What website traffic rankings are good for
The strongest use is relative benchmarking. If the same tool, settings and period place several comparable sites in a consistent order, that reveals market structure even when absolute totals are imperfect.
- Identifying the largest apparent competitors in a defined market.
- Spotting sites gaining or losing relative visibility over three to six months.
- Finding publishers or communities that may influence your category.
- Prioritising which competitor domains deserve manual content and link analysis.
- Comparing channel mix at a directional level, such as search-led versus referral-led businesses.
- Checking whether a partnership or acquisition target operates at a plausible scale.
Use rankings as a screening layer, not a verdict. If five rivals are reported at 1.8 million, 1.4 million, 980,000, 910,000 and 870,000 visits, the order may be informative, but the gap between 980,000 and 910,000 is not necessarily meaningful. As a working rule of thumb, we treat differences below roughly 10% to 20% as a tie unless the provider shows strong coverage for that market. This is a decision threshold chosen to avoid false precision, not a universal error rate.
What website traffic rankings are not good for
- Your official KPI: report your own traffic from first-party analytics.
- Sales forecasts: validate demand with your own leads, conversion rates and revenue.
- Judging a campaign in 7 to 14 days: models update slowly and lag short-term changes.
- Comparing with app-first businesses: web estimates miss app activity.
- Audited evidence: procurement, investment or legal documents need verified data.
- Inferring profitability: traffic says nothing about margin or conversion.
- Claiming a specific share of a competitor’s loss: an SEO project cannot be credited with a precise percentage of modelled competitor traffic.
Placing a competitor’s modelled number next to your measured sessions as if they were equivalent is misleading. Put them in separate columns and label them.
Rank positions versus visit estimates
Many lists show a rank (for example “global rank 48,210”) rather than a visit count. A rank is even more fragile than a visit estimate, for three reasons.
- Ranks compress differences. Moving from rank 48,000 to 52,000 may reflect a trivial change in visits, while moving from rank 500 to 600 can mean a large one. The relationship is not linear.
- Ranks depend on everyone else. Your position can fall because other sites grew or because the provider changed its panel, even when your own traffic is flat.
- Category and country ranks use different pools. A top-10 category rank in one country is not comparable with a top-10 rank in another.
If you must quote a rank, quote it with the date, scope and tool, and prefer rank movement over several months to a single snapshot. When the decision matters, convert the rank back into an estimated visit range and apply the same uncertainty described above.
Questions to ask before trusting any list
- Is the figure a modelled estimate, a directly measured number from connected analytics, or a mix?
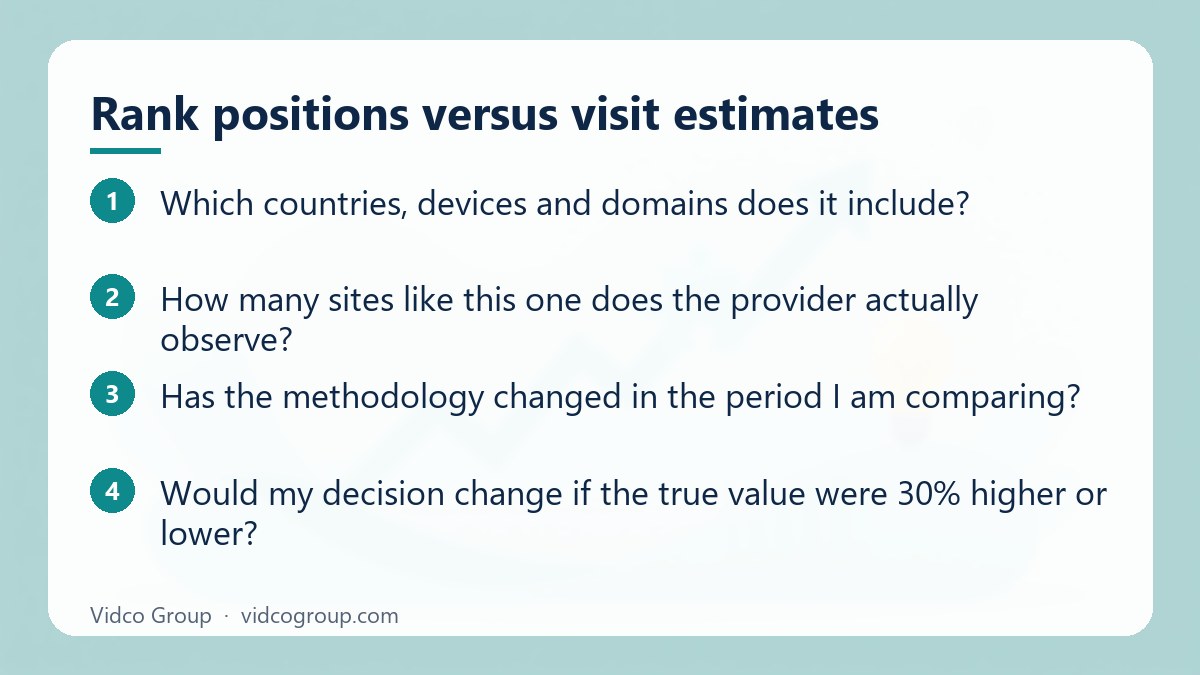
- Which countries, devices and domains does it include?
- How many sites like this one does the provider actually observe?
- Has the methodology changed in the period I am comparing?
- Would my decision change if the true value were 30% higher or lower?
If the answer to the last question is yes, the estimate alone is not enough evidence for that decision.
Decision table: can I rely on this number?
| Situation | Reliance | What to do |
|---|---|---|
| Large, mainstream site (hundreds of thousands of visits or more), same tool and settings | Moderate for scale and ordering | Use ranges; compare trends not single months |
| Mid-size site (roughly 5,000 to 100,000 monthly users), consistent comparison set | Moderate to low | Triangulate with a second tool and search data |
| Small or niche site (under roughly 5,000 monthly visits) | Low | Do not quote the number; use qualitative signals |
| Site driven by apps, email or offline media | Low | Ask for first-party data or use another benchmark |
| Comparing your measured traffic with a modelled competitor | Not equivalent | Label metrics separately; never subtract |
| Decision with real money at stake (acquisition, pricing, forecast) | Insufficient alone | Request analytics access or a third-party audit |
| Short-term spike or drop (under a month) | Low | Wait for a longer window |
How to validate an estimate in an afternoon
You can often test whether a tool is trustworthy for your market by calibrating it against sites whose true traffic you know.
- Pick a calibration set. Use your own site plus any sites whose owners will share analytics screenshots (partners, clients, friendly publishers). Aim for at least five sites in similar size bands.
- Match definitions. Export visits or sessions from Google Analytics for the same country, device scope and dates the tool reports. Confirm the tool’s metric (visits, not users).
- Compute the error ratio. Divide the tool’s estimate by the real figure for each site. A ratio near 1 means close; 2 means double.
- Look at the spread. If ratios cluster tightly (say 0.8 to 1.2) the tool is consistent for your market and you can use it for rankings. If they scatter from 0.3 to 3, treat any single number as unreliable.
- Check direction over time. Compare month-over-month changes against real changes. Even a biased tool is useful if its trend matches reality.
- Cross-check search data. For organic search, compare against Search Console clicks for your own site to see how far search estimates sit from Google’s own numbers.
- Record the result. Note the tool, settings, date and the error range you observed, and reuse that range when reporting.
This calibration will not make a tool accurate, but it replaces assumptions with a measured error band for your niche.
How much should you spend validating the data?
Match the effort to the decision.
| Decision type | Reasonable validation | Why |
|---|---|---|
| Casual competitor scan | None beyond stating the source and settings | Low stakes |
| Content or SEO prioritisation | Cross-check two tools and confirm with a manual SERP review | Moderate stakes |
| Annual marketing plan or budget share | Calibration set plus range reporting | Budget depends on market size |
| Acquisition, investment, pricing or forecast | Request first-party analytics access, a data-room export or an independent audit | Money and legal exposure; estimates are insufficient |
If a decision would change by less than the plausible error of the estimate, extra validation is usually wasted. Spend the effort where the answer could flip the decision.
A reporting template that avoids false precision
Use this structure whenever third-party traffic appears in a report or slide.
| Field | Example entry |
|---|---|
| Source and tool | Named provider and plan |
| Metric definition | Monthly visits, not users |
| Scope | Domain including or excluding subdomains; country; device |
| Period | Calendar months or rolling window, with dates |
| Estimate shown as | A range or rounded figure, never to the unit |
| Confidence note | Low, medium or high, with reason (site size, calibration result) |
| What it supports | Ranking order, trend direction, or scale only |
| What it does not support | Revenue, conversion, exact share, KPI targets |
| First-party comparison | Own measured traffic shown in a separate, labelled column |
Round to two significant figures and call ties ties. “Roughly 1 million, similar to competitor B” is more honest, and more useful, than “1,043,217 visits, 3.2% ahead of B”.
Common mistakes
- Quoting a rank or visit number without the tool, country, device and date.
- Treating organic-only estimates as total traffic.
- Subtracting a modelled competitor number from a measured own number.
- Comparing one tool’s figure for site A with another tool’s figure for site B.
- Reading small month-to-month moves as real changes.
- Using estimates for sites with only a few thousand visits.
- Ignoring non-web channels such as apps, email and offline.
- Assuming old accuracy studies still describe today’s models.
Frequently asked questions
How accurate are website traffic rankings?
Accuracy varies by tool, market and site size. Independent tests show reasonable agreement on large sites and large errors on small ones, and different tools can disagree by tens of percent. Treat estimates as ranges and use them for relative comparison, not exact counts.
Which traffic estimation tool is the most accurate?
No single tool wins on every measure. In the SparkToro comparison, one tool tracked changes in Google Analytics best while another more often landed within a set error band on larger sites, and older tests ranked tools differently again. Test candidates against sites whose real traffic you know.
Why does Similarweb show different traffic from Semrush or Ahrefs?
They use different data sources, definitions and models, and some estimate only organic search. Differences in country, device, domain scope and date range also change the figure. Compare tools only when these settings match.
Are traffic estimates reliable for small websites?
Generally not. With few observed visits the models rely on extrapolation, and published tests found the largest errors for sites with only a few thousand monthly visits. Prefer first-party analytics or qualitative signals for small sites.
Can I use competitor traffic estimates as a KPI?
No. Use them as context for market structure and trends. Your KPI should come from first-party analytics, conversions and revenue.
What is the difference between traffic rankings and Google Analytics data?
Google Analytics records activity on your own site through your tracking setup. Traffic rankings model activity for sites they cannot measure directly, using samples and statistics, so they carry unknown error.
How can I check a competitor’s real traffic?
You usually cannot see it without their cooperation. You can triangulate with several tools, search visibility, social following, backlink and mention growth, or ask for verified analytics access in partnership or acquisition contexts.
How often should I refresh traffic estimates?
Monthly or quarterly with the same settings is enough for most benchmarking. Daily or weekly checks mostly track model noise rather than real change.
Conclusion and next steps
Website traffic rankings are a modelled view of the web, valuable for seeing who is large, who is rising and who competes with you, and unsafe as precise numbers. Calibrate any tool you rely on against sites with known analytics, report ranges rather than false precision, and keep your own measured traffic separate from estimates. A practical next step is to build a small calibration set this week and record the error band for your market.

Sources
- SparkToro: Which 3rd-party traffic estimate best matches Google Analytics?
- Screaming Frog: How accurate are website traffic estimators?
- Google Analytics Help: How Google Analytics works
- Google Search Console: about the product
- Semrush Knowledge Base: Traffic Analytics
Updated: October 2026. Study figures are quoted from the published write-ups and are several years old; check the original sources and your own calibration before relying on them.
Related reading
How Vidco Group can help
If you need competitor benchmarking you can defend in a board meeting, Vidco Group can build a calibration set, document metric definitions and report ranges alongside your first-party data. Contact us to discuss your market.
Need an SEO, AEO or GEO strategy?
The Vidco Group team is ready to work with you